
Introduction
Mentions are not meaning. A hundred low‑quality clips can’t match a single, credible story that moves how people think and act. If your reporting still lists “# of articles” and “potential reach,” you’re flying by vanity metrics. This guide reframes PR measurement around reputation KPIs—signals that show your story was understood, trusted, and did something: clarified a problem, changed consideration, or opened doors with stakeholders.
We’ll adapt AMEC’s Input→Output→Outtake→Outcome model for modern comms, define a practical KPI set, and show formulas and dashboards you can implement this quarter—without a million tools.
Why Mentions Don’t Equal Impact
- Quantity ≠ quality: not all outlets, authors, or contexts carry the same weight.
- Reach is modeled, not real: “potential impressions” often assume every reader saw your story.
- Headline bias: short‑term spikes mask long‑tail effects (search lift, sales cycles, recruiting).
- Attribution blind spots: last‑touch analytics miss PR’s mid‑funnel role.
Principle: Measure what a story says, who says it, who acts on it, and how it lives in search, links, and conversations.
The Measurement Stack (Adapted AMEC)
- Inputs: resources and readiness (angle quality, assets, spokespeople).
- Outputs: what you published/pitched and where coverage appeared.
- Outtakes: what audiences understood and felt (message recall, sentiment, credibility).
- Outcomes: what changed (search, traffic, pipeline, policy, hiring).
- Risk: corrections, misinformation, crises averted.
You need a few great KPIs per layer, not 30 dashboards.
Core Reputation KPIs (with Definitions & Formulas)
1) Quality of Coverage Index (QCI)
Score each article on dimensions that correlate with trust and utility.
Rubric (0–2 points each):
- Tier & relevance: outlet covers your beat; journalist credibility.
- Message pull‑through: your key message appears verbatim or accurately paraphrased.
- Evidence quality: includes numbers, named customers, or independent sources.
- Link equity: dofollow link to a relevant owned page (or proper source citation).
- Tone & accuracy: neutral/positive and factually correct.
QCI per article = sum(above) / 10; report Avg QCI and % High‑QCI (≥0.7) per campaign.
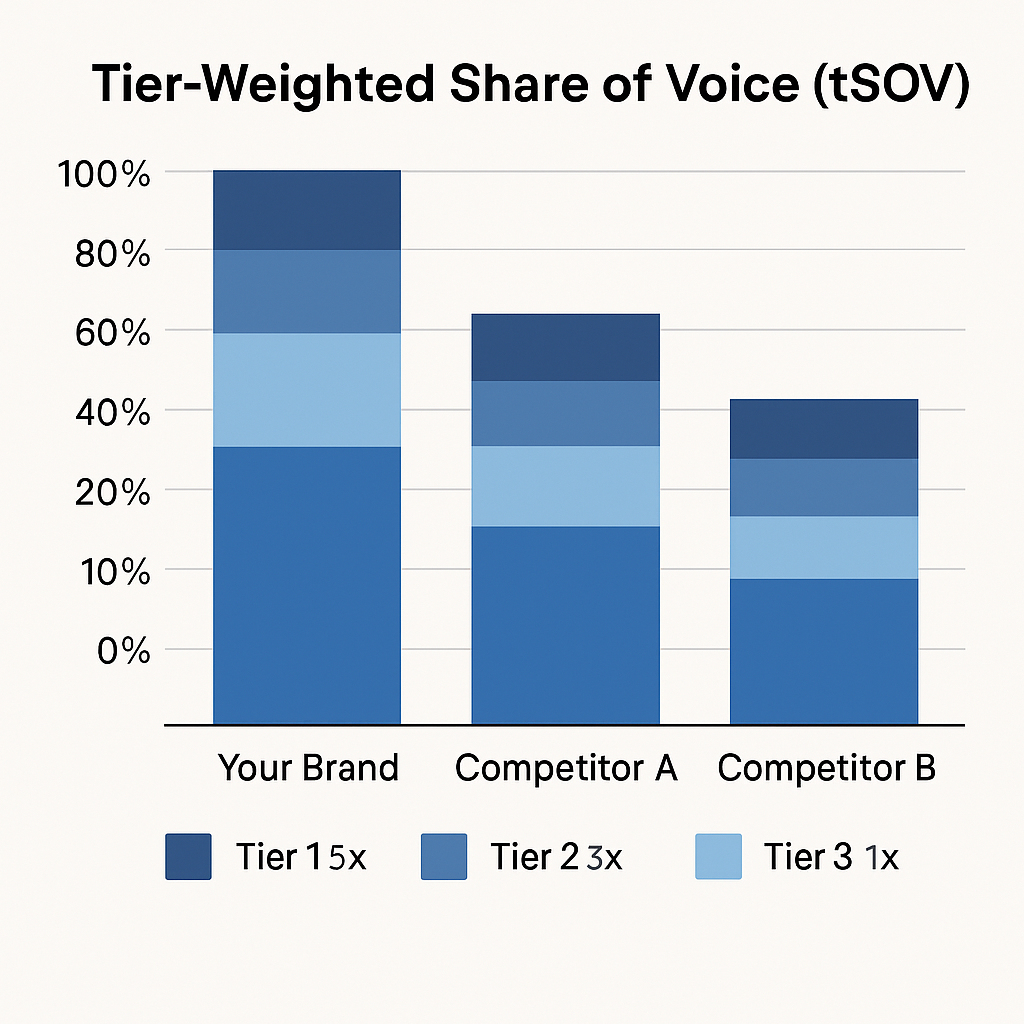
2) Tier‑Weighted Share of Voice (tSOV)
Not all mentions are equal. Weight by outlet tier and by message relevance.
tSOV = (Σ your clips × tier weight × message score) ÷ (Σ category clips × tier weight × message score) over the same period.
Suggested weights: Tier‑1=5, Tier‑2=3, Tier‑3=1; message score: 1 if the core message appears, 0.5 if tangential, 0 if absent.
3) Message Recall / Pull‑Through Rate
% of clips that include your headline claim or proof line. Track separately for headline, nut‑graf, and quote.
4) Credibility‑Weighted Sentiment
Generic sentiment is noisy. Weight sentiment by outlet authority.
CW Sentiment = (Σ sentiment score × tier weight) ÷ (Σ tier weight).
Use −1/0/+1 for negative/neutral/positive; allow an “accurate but negative” category so teams don’t game real news.
5) Authority & Link Quality
- New referring domains from earned coverage (month‑over‑month).
- % dofollow to a non‑homepage, relevant destination (press page, explainer, data brief).
- Anchor relevance (contains product/solution/category vs. “click here”).
6) Brand Search Lift (Causal Window)
Measure incremental branded queries and navigational clicks in the −7 to +14 day window around a major story. Normalize against a 28‑day baseline and, where possible, use a holdout (market/geo without coverage).
Lift = (period avg − baseline avg) ÷ baseline avg. Report with a small method note.
7) Direct & Referral Traffic to Proof Pages
Track sessions and read‑depth (scroll 50%+) on the exact pages editors linked (newsroom, explainer, data brief) within 72 hours of coverage.
8) Pipeline Influence (Leading Indicators)
You rarely get last‑click conversions from PR. Instead track:
- Demo requests from accounts visiting within 7 days of Tier‑1 coverage.
- Account touches: # ICP accounts with first‑ever session, or return after >90‑day gap.
- Sales notes citing coverage in the discovery call.
9) Spokesperson Effectiveness
- Quote acceptance rate (# stories using your quote ÷ # interviews).
- Callback velocity (median minutes to reporter reply after outreach).
- Correction rate (lower is better; goal ≈ 0).
10) Risk & Resilience
- Corrections & clarifications issued (with resolution time).
- Misinformation containment (time to post a corrective link/thread).
- Crisis drill scores (readiness index quarterly).
Dashboards That Actually Help Decisions
Executive Snapshot (Monthly)
- tSOV vs. two nearest competitors
- Avg QCI and % High‑QCI clips
- Brand search lift on major stories
- Top 3 articles by referral+read‑depth
- Pipeline influence (accounts touched, demos from ICP)
Comms Ops (Weekly)
- Pitches sent, callbacks, acceptance rate
- Quote usage, link quality, sentiment with outlet weighting
- Spokesperson performance heatmap
- Upcoming pegs and the proof pack readiness checklist
SEO/Content (Shared)
- New referring domains from earned media
- Anchor text themes and destination URLs
- Owned explainer performance (time on page, scroll, CTA clicks)
Data Sources & Minimum Stack
- Coverage & context: your media database, manual curation for QCI.
- Search: Search Console for branded queries and navigational clicks.
- Web analytics: GA4 (or equivalent) for referral sessions and read‑depth events.
- CRM: flag “press‑touched” accounts (UTM or analyst notes).
- Surveys (optional): quarterly aided/unaided awareness and trust battery.
Keep it scrappy: a shared spreadsheet with a QCI rubric and a Looker/Datastudio board is enough to start.
Implementation: 30‑Day Plan
Week 1 — Define & Align
- Choose 6–8 KPIs from above; write exact definitions and formulas.
- Build a QCI rubric in a sheet and train the team on scoring.
- Instrument read‑depth on press pages; set up UTM standards.
Week 2 — Backfill & Baselines
- Score the last 90 days of coverage (top 50 clips).
- Establish baselines for branded search and press‑page engagement.
- Map competitors for tSOV.
Week 3 — Connect to Revenue
- Create a press‑touched field in CRM.
- Align with sales on a short note template: “Saw you in [Outlet].”
- Build an accounts‑touched chart by week.
Week 4 — First Executive Readout
- Present the new dashboard, wins (e.g., 3 High‑QCI clips driving 62% of referral reads), and the plan to raise QCI next month (better proof, tighter quotes, targeted outlets).
How to Raise Reputation KPIs (Levers You Control)
- Higher QCI: pitch fewer, better outlets; include a numbers doc; offer a customer on‑record; provide an SVG chart and alt text; write quotes in plain English.
- Better tSOV: tailor angles by beat; prioritize Tier‑1 with exclusive data; avoid quantity‑only pushes.
- Brand search lift: publish an Owned Explainer the morning coverage drops; embed the article; answer the questions searchers will ask.
- Referral read‑depth: design press pages like landing pages: fast, scannable, with a single next step.
- Spokesperson effectiveness: coach the 20‑second soundbite with one proof and one limitation line.
Avoid These Measurement Traps
- Gaming sentiment: calling accurate criticism “negative” to protect a KPI. Accept reality; focus on fixes.
- Counting “potential reach”: report real referral traffic and search lift instead.
- No control periods: compare against baselines and, when possible, holdouts.
- Attribution absolutism: PR is a contributor—track influence, not just last‑click.
- Messy taxonomies: define tiers, beats, and messages once and reuse.
Sample KPI Glossary (Copy/Paste)
- High‑QCI clip: QCI ≥ 0.7 (tier, message, evidence, link, tone).
- tSOV: Tier‑weighted share of voice in category coverage (rolling 30 days).
- Message pull‑through: % of clips containing the headline claim.
- Brand search lift: Δ in branded queries vs. 28‑day baseline around a story window.
- Press‑touched account: ICP account with a session within 7 days of Tier‑1 coverage.
- Read‑depth: % of sessions reaching ≥50% scroll on a target page.
Conclusion
Great PR earns trust and useful understanding, not just ink. When you measure quality, credibility, and behavior change—then tie those signals to search, traffic, and account movement—you’ll know which stories build reputation and which don’t. Start small, score honestly, and iterate. The point isn’t prettier reports; it’s better stories that matter.

Add comment