
Thesis: KPIs tell you how the system is behaving. OKRs tell you what you will change. Strategy happens when you connect the two: a small, honest KPI system that describes reality → a few outcome‑focused OKRs that push on the right levers → weekly execution that learns fast.
1) The Chain: Vision → Strategy → KPIs → OKRs → Initiatives
- Vision: The long‑term change for customers/market.
- Strategy: Where to play and how to win (positioning, ICP, channels, advantage).
- KPIs (descriptive): Health of the system (North‑Star + drivers + guardrails). Lagging and leading.
- OKRs (prescriptive): What we choose to achieve this quarter/half to bend the KPIs.
- Initiatives: Concrete work: projects, experiments, launches, process changes.
Rule: If an OKR doesn’t move a KPI that matters to strategy, it’s busywork.
2) Build the KPI System First (so OKRs aren’t guesses)
A) Choose a North‑Star Metric (NSM) — an outcome that captures compounding customer value (e.g., Weekly Activated Teams, Successful Matches/week, Orders from Returning Customers).
B) Map the Driver Tree
NSM
 ├─ Acquisition drivers (e.g., SQL rate, CAC)
 ├─ Activation drivers (time‑to‑value, checklist completion)
 ├─ Engagement drivers (weekly core actions/team)
 └─ Monetization drivers (ARPA, expansion rate)
C) Add Guardrails — UX, reliability, finance, and trust (e.g., INP p95 ≤ 200ms, refund rate ≤ 1.2%, CAC payback ≤ 12 mo). If a guardrail trips, the OKR pauses.
D) Define each KPI — owner, query, units, baseline, variance (µ±σ), and a measurement cadence.
3) Translate Strategy into OKRs (a discipline, not a slogan)
Objectives are qualitative, directional, and strategy‑aligned. Key Results are quantitative outcomes tied to KPIs (never tasks).
Checklist for a good KR:
- Outcome not output (e.g., increase SQL→Won conversion to 24% not ship new proposal template).
- Bounded by time and scope (quarter/half, target segments).
- Measurable from the KPI definition (same query/owner).
- Ambitious but believable (top‑down aspiration × bottom‑up feasibility).
- Guardrails respected (no cannibalizing margin/UX to hit a number).
Setting targets: Use baseline µ and σ. Stretch = µ + 1–1.5σ for noisy drivers; 2σ for stable ones. For multiplicative changes, choose MDE you’d act on and power your experiments.
4) Worked Examples (pick your model)
A) B2B SaaS (Sales‑assist)
Strategy insight: Win more mid‑market logos by reducing cycle friction and lifting win rate.
KPI snapshot (baseline): SQL rate 28%; Win rate 18%; Cycle 54 days; CAC payback 14 mo (guardrail ≤ 12).
Objective (H1): Shorten the path to value and convert more qualified deals in mid‑market.
Key Results
- KR1: Increase SQL→Won win rate from 18% → 23% (±1 pp) in MM segment.
- KR2: Reduce median sales cycle from 54 → 42 days without raising discount rate.
- KR3: Lift expansion ARR share from 21% → 27% via packaged add‑ons.
- Guardrails: CAC payback ≤ 12 mo; refund rate ≤ 1.0%; INP p95 ≤ 200ms.
Initiatives (examples)
- Proposal system revamp with proof‑pack inserts; mutual success plans.
- ‘No‑demo’ triage route for clear ICPs; pricing drivers on website.
- Expansion playbook: add‑on bundles + sales‑assist email set.
- Experiments: A/B on proposal template; switchback on limited‑time add‑on bundle.
B) PLG SaaS (Self‑serve)
Strategy insight: Activation is the growth throttle.
KPI snapshot: Trial→Activation 36%; Weekly Core Actions/team = 2.1; Day‑30 retention 41%.
Objective (Q3): Increase activation and early retention for new workspaces.
Key Results
- KR1: Raise trial→activation from 36% → 44% for new workspaces.
- KR2: Increase Week‑1 checklist completion from 38% → 55%.
- KR3: Lift Day‑30 retention from 41% → 48% for SMB segment.
- Guardrails: INP/LCP within CWV; support ticket rate ≤ baseline +10%.
Initiatives
- Intent‑triggered tips (post‑import), demo data sandbox, first‑run checklist.
- Email/SMS nudges tied to gaps; optimistic UI for key flows.
- Experiment program: 5 A/Bs with SRM guardrails; power for +10% relative lift.
C) E‑commerce (DTC)
Strategy insight: Profitably grow repeat revenue.
KPI snapshot: Orders from returning customers/week = 3,400; AOV $78; Refund rate 1.4%.
Objective (Q2): Grow profitable repeat orders without promo dependency.
Key Results
- KR1: Increase returning‑customer orders from 3,400 → 4,100/week.
- KR2: Lift PDP→Cart rate by +12% relative on mobile.
- KR3: Reduce repeat purchase share with promo from 62% → 48%.
- Guardrails: Gross margin ≥ 64%; refund rate ≤ 1.5%; LCP ≤ 2.5s.
Initiatives
- Lifecycle offers by cohort; post‑purchase bundles; delivery ETA clarity.
- Micro‑interactions pack for forms/checkout (masks, inline errors, sticky CTA).
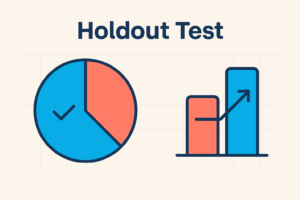
- Offer tests: BOGO vs bundle pricing; geo holdout for brand search.
5) Cadence: Plan monthly, steer weekly
- Quarter/Half: lock OKRs; publish KPI baselines; forecast P50/P80.
- Monthly: review KR progress; retire/replace non‑moving initiatives.
- Weekly ops: NSM + 3–5 drivers + any red guardrails; discuss learning, not vanity deltas.
- Experiment cadence: ship readouts w/ confidence intervals; decide go/stop/iterate.
Meeting skeleton (45 min):
- KPI deltas vs baseline (10m)
- KR status & blockers (15m)
- Decisions & next bets (15m)
- Risks & guardrails (5m)
6) Instrumentation: make KPIs computable and OKRs auditable
- Event contracts with typed properties; SRM alarms for experiments.
- Metric dictionary: one‑pager per KPI (definition, owner, SQL, caveats).
- Data SLOs: freshness, completeness, validity; trust badge on dashboards.
- Forecasts with intervals where relevant (pipeline, revenue, demand).
- Access controls aligned to privacy posture (user‑level behind consent).
7) Writing the OKR (templates)
Objective: [Qualitative, directional]
KRs:
- KR1: Increase from X → Y (segment/market) by date.
- KR2: Reduce from A → B without breaching .
- KR3: Achieve of T with ± error band.
Anti‑patterns:
- KRs that are tasks/output (“launch X”).
- KRs that rely on unowned metrics or undefined queries.
- Too many KRs (>4 per Objective).
- Conflicting KRs (e.g., push paywall views and reduce churn without a guardrail).
8) Connecting top‑down & bottom‑up
- Top‑down sets the direction (strategy, NSM, guardrails, budget).
- Bottom‑up proposes feasible KRs and initiatives given baselines and traffic/power.
- Resolve gaps by adjusting scope, not redefining metrics.
- Use leading indicators to see if you’re on‑track before lagging KPIs move.
9) Evidence & learning: close the loop
Every KR should have a clear evidence plan:
- What moves if we’re right? (leading signal)
- What will we test? (design, MDE, power)
- What’s the decision rule? (OEC + guardrails)
- How will we document? (result + queries + next bet)
Archive OKRs with outcomes, not just scores. Re‑use what worked; retire what didn’t.
10) 30‑60‑90 Day Implementation Plan
Days 1–30: Draft NSM + driver tree + guardrails; write KPI one‑pagers; publish baselines; clean up event contracts.
Days 31–60: Translate strategy into 1–2 company‑level Objectives + 3–5 KRs each; cascade to teams; size experiments; wire dashboards.
Days 61–90: Run weekly/Monthly cadence; ship readouts; prune dead KRs; snapshot learnings; plan next quarter with evidence.
11) One‑page examples (copy‑ready)
Objective: Grow efficient mid‑market revenue.
- KR1: Win rate MM 18% → 23%
- KR2: Cycle 54 → 42 d
- KR3: mROAS (YouTube) ≥ 1.6 in lift test
- Guardrails: CAC payback ≤ 12 mo, refund ≤ 1.0%, INP ≤ 200ms
- Initiatives: proposal revamp; pricing drivers; add‑on bundles; geo‑lift on YouTube
Objective: Increase activation for new workspaces.
- KR1: Trial→Activation 36% → 44%
- KR2: Checklist completion 38% → 55%
- KR3: D30 retention 41% → 48%
- Guardrails: CWV green; support tickets ≤ baseline +10%
- Initiatives: demo data; intent tips; lifecycle nudges; A/B pack
Bottom line: KPIs describe your system; OKRs change it. Connect them with a clear North‑Star, a driver tree, guardrails, and evidence‑based KRs—and you’ll turn strategy into weekly progress you can prove.


Add comment